Welcome to the MADWEB Archive


What is MADWEB (Meteoroids and Debris Website)?
Three major impact studies have been carried out to date by the European
Space Agency (ESA) to
investigate the effects of micrometeoroids and space debris impacts
on satellite hardware. One of these studies analysed hardware retreived from
the European Retrievable Carrier (EURECA), and the other two
looked at solar array assemblies from the Hubble Space Telescope (HST), returned to Earth by HST Servicing
Missions.
On the right hand side you can find the topics and questions that drive
the current Post Flight Analysis efforts.
The Post Flight Analysis descriptions below provide an overview about
hardware retrieved from Eureca and HST.
Included are information about flight times, and a list of available reports.
|
|

|
|
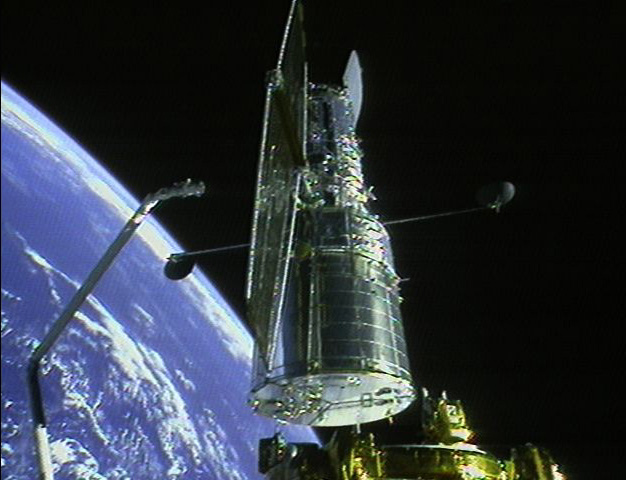
Hubble Space Telescope (HST)
|
|
|
|
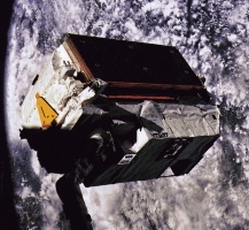
European Retrievable Carrier (EURECA)
|
|
|
Why Perform Post-Flight Analysis?
Positioning in space debris research
Micrometeoroids and Space Debris
Natural and man-made small objects in space
Hypervelocity Impact
The physics of impacts at high speeds
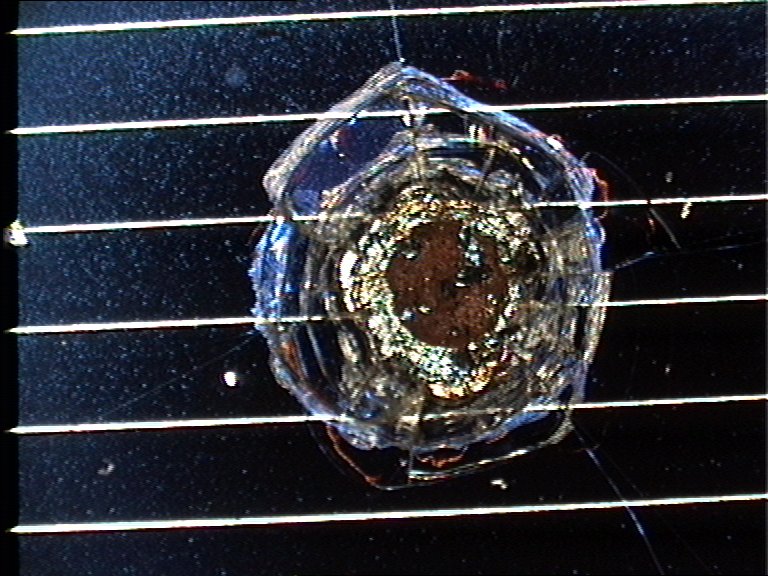
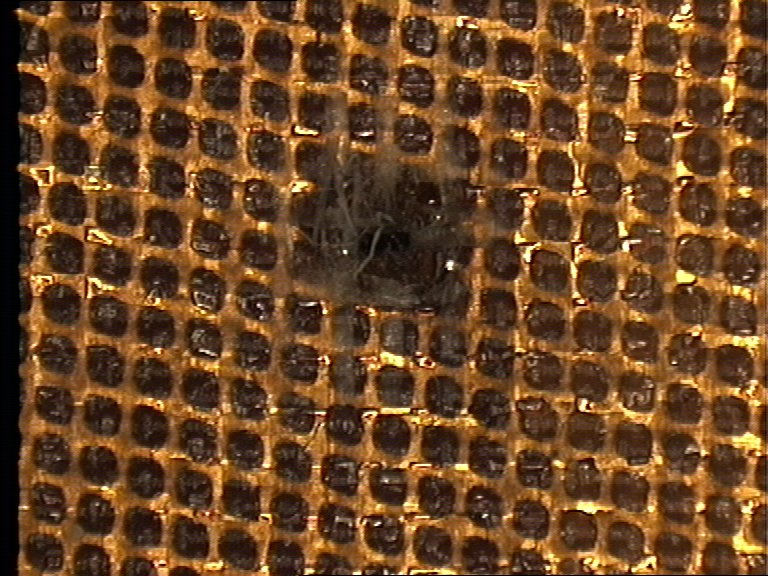
Impact Features
How to measure and categorise an impact
Fluxes
Amount and severity of impacts per duration
Damage Equations
Impact behaviour as parametric equations
Models
Describing the satellite environment
|
1. EURECA Post Flight Analysis 1/2:
Retrieved by the Space Shuttle in June 1993 after 326 days in space at an altitude around 500 km.
Total exposed surface area ~ 140 square metres.
Solar Cells -
Multi-Layer Insulation & Other Surfaces -
Residue Analysis.
2. HST Post Flight Analysis 1:
One solar array assembly wing was retrieved in December 1993 after 3.62 years in orbit (~ 600 km altitude).
Total exposed surface area ~ 40 m2.sqm.square metres.
Solar Cells -
Multi-Layer Insulation & Other Surfaces -
Residue Analysis.
3. HST Post Flight Analysis 2:
Two solar array assemblies were retrieved in March 2002 after 8.24 years in orbit (> 600 km altitude).
Total surface area ~ 120 sqm.square metres.
Solar Cells.
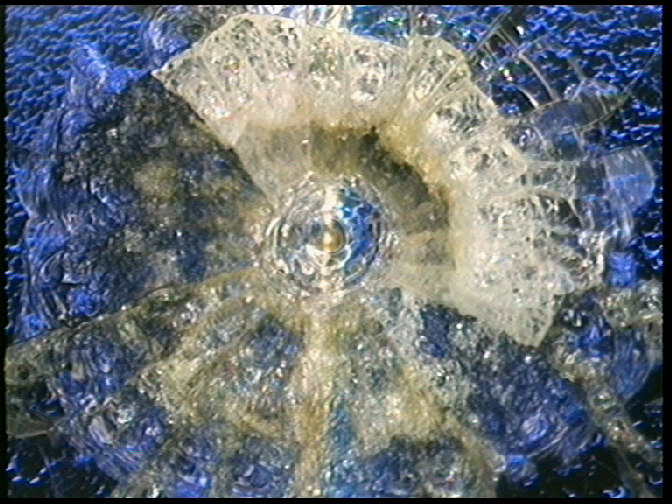
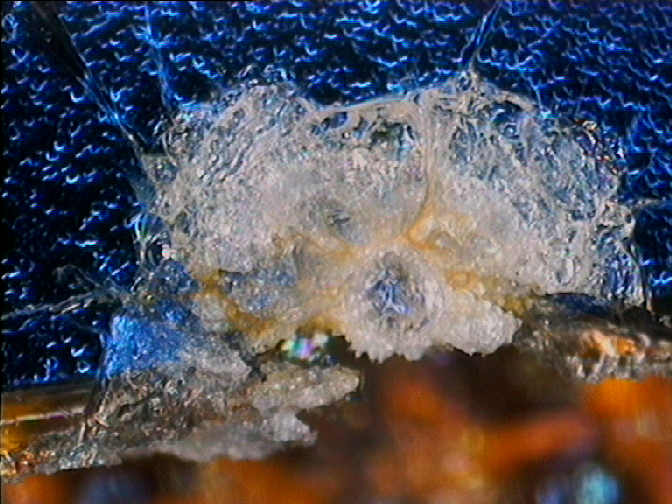
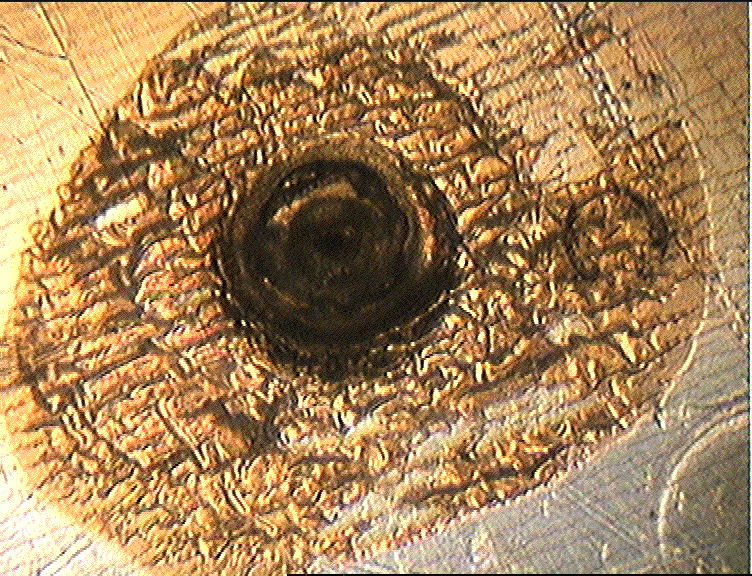
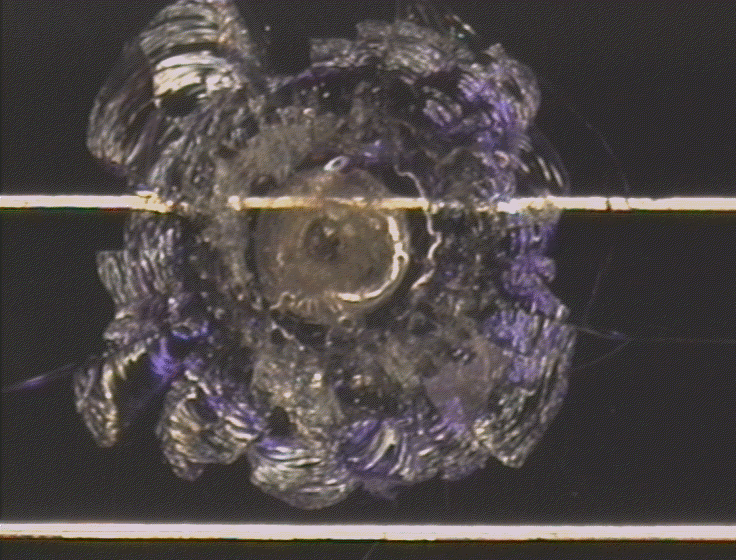
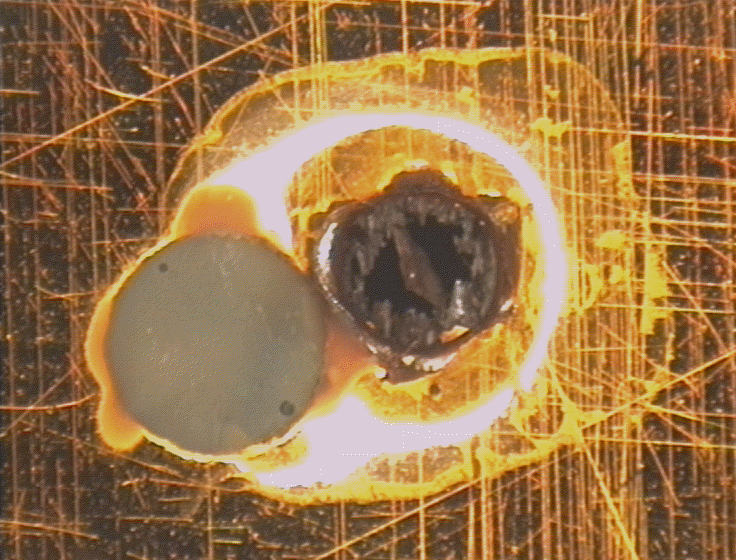
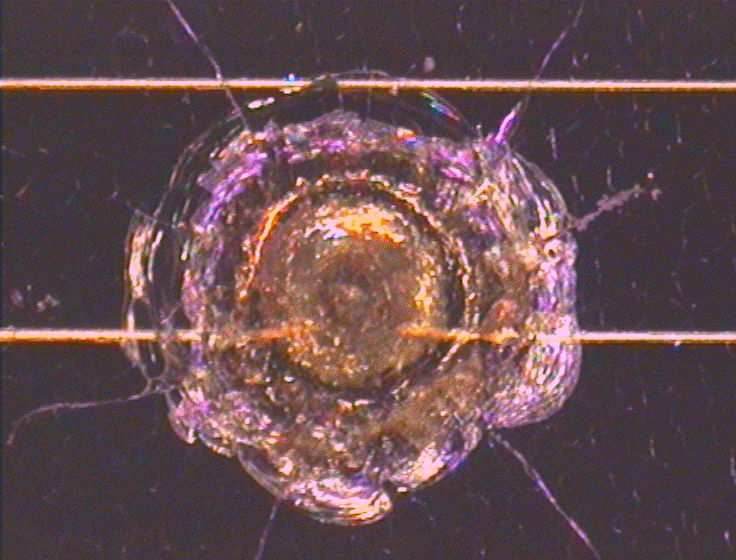
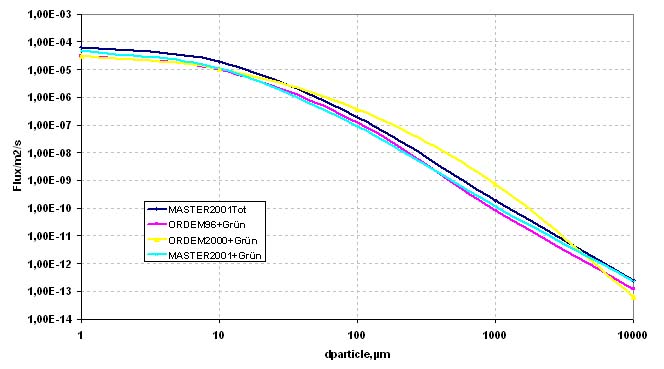
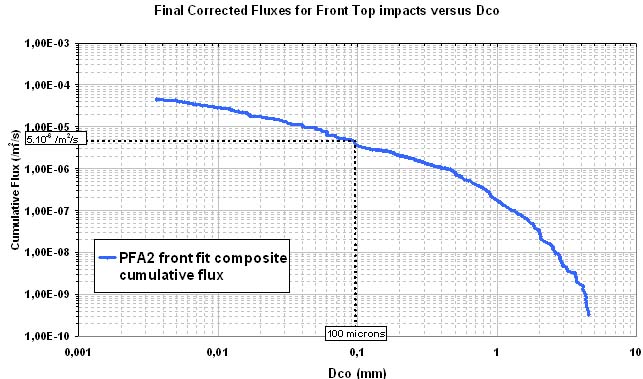
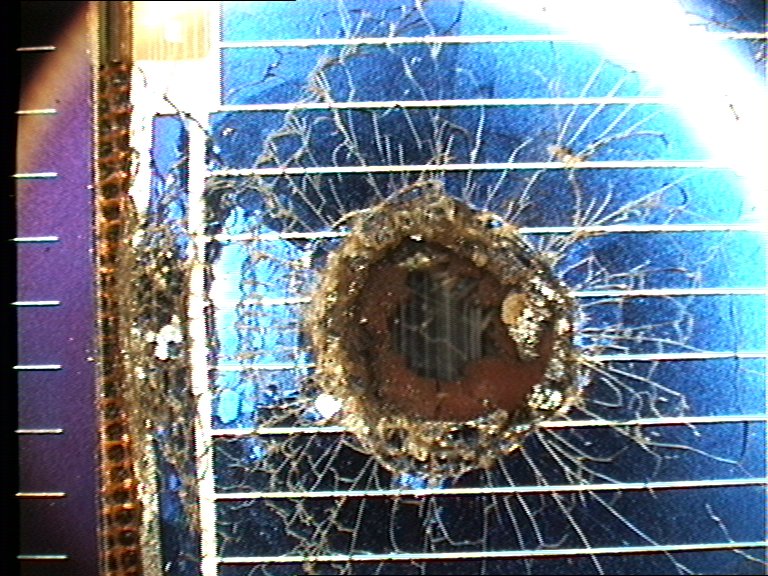
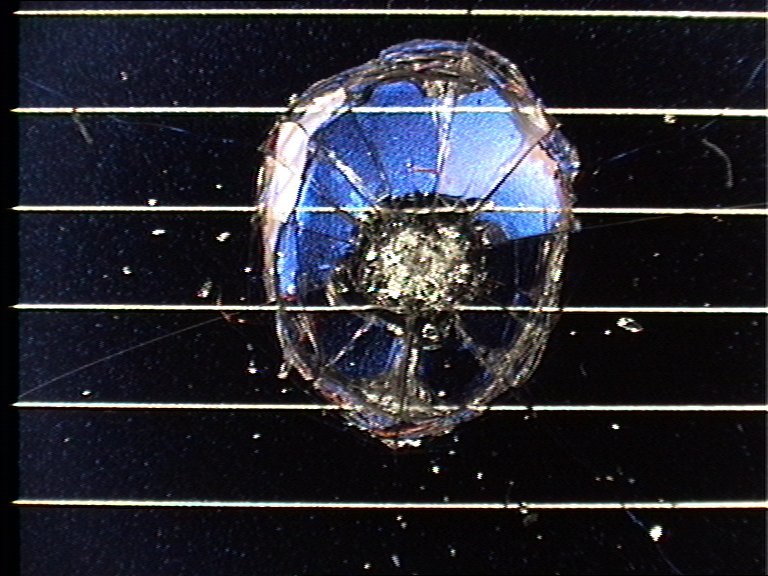
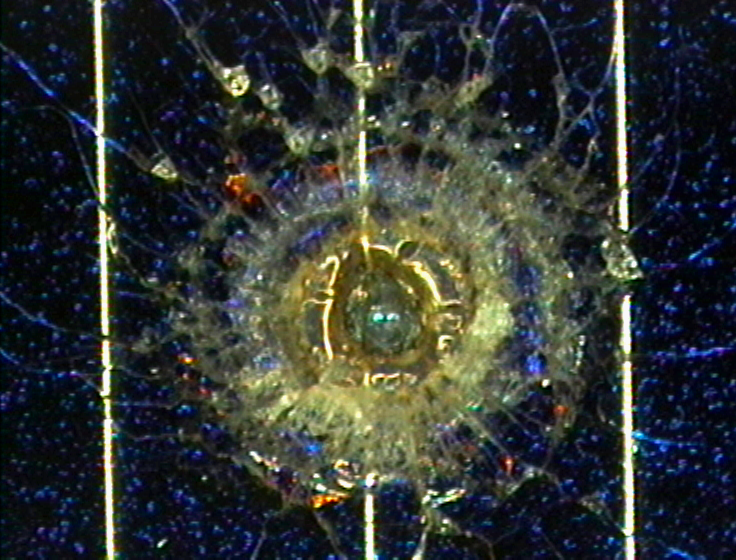
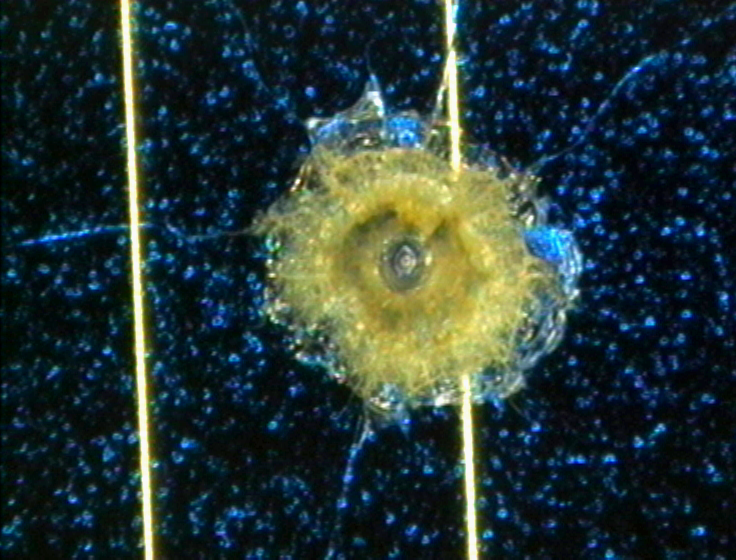
Examples of Impact Features and Derived Fluxes
The following images are a small selection of the solar cell, residue analysis,
MLI and other surfaces photos within this website, as well as derived fluxes.
For further information please contact: M. Millinger (ESA/ESTEC/TEC-EPS)


/41_A8crater1/41_A8crater1c.png)