

During post-flight analysis of retrieved materials, impacts features are counted and diameters are measured. However these impacts occurred accumulate over all the time of the mission, and so it is only possible to obtain an average particle flux by dividing the number of impacts by the exposure time. Moreover, the curve plotting this flux gives only the flux of particles equal to or greater than the size given on horizontal axis, namely the cumulative (c.f. differential) flux.
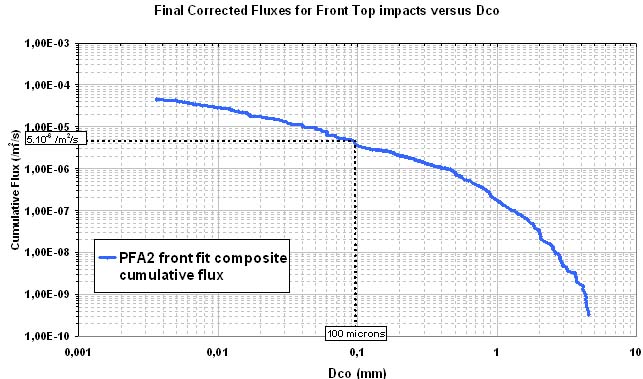
Figure 5. Cumulative flux distribution giving the number of impacts per m2 per second versus impact diameters in mm: as an example, there are 5.10-6 impact craters of 100 microns or greater per m2 per second (some 160 per year on 1 square metre) on HST solar arrays.