

The Excel based pages have a number of sheets, which will be explained below:
Database Simplified
This sheet categorizes the images in respect to their position on HST.
The impact position consists of solar panel array (SPA: -V2 for "left" wing and +V2 for "right"; the letter after that identifies the fields) and cell identifier.
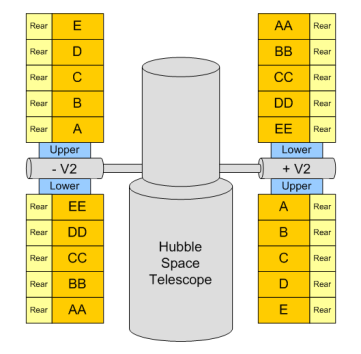
Figure 1: HST Schematic
The cell identifier is unique but does not follow a continuous pattern (?). You can find the them in the HST PFA2 Final Report, or contact us directly.
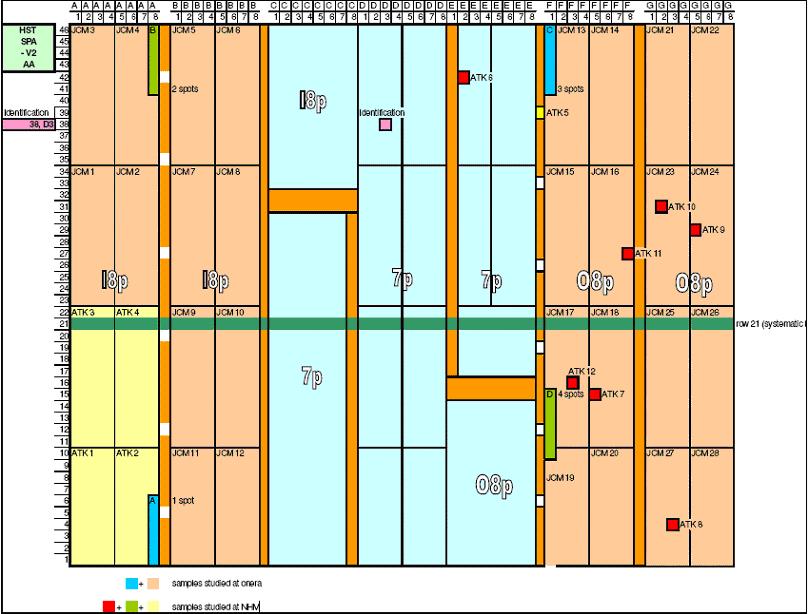
Figure 2: Example of Cell Identifiers
The impact type has to parts. The first two letters determine the direction of the impact:
- FT: Front-Top: craters are caused on Front face by impacts from the same face.
- FB: Front-Back: craters are caused on front side by impacts from the back side.
- RT: Rear-Top: impacts are caused by projectile coming from the rear side and impacting the rear surface.
- RB: Rear-Back: craters are caused on rear side by particles impacting the front surface.
The second part (after the underscore) denotes the classification (see also HST PFA2 Technical Note 4, Appendix A):
- Class A: Front-Back/Near-Circular Impact, penetrated glass (?)
- Class B: Front-Back/Near-Circular Impact, eroded glass (?)
- Class C: (?)
- Class P: Pair - penetrated both front and rear panel
The picture names are unique but do not follow a continuous pattern (?).
In the engineering unit section, the following units can be found:
- Dp: Central pit.
- Dco/Dos: Outer shatter or spall area.
- Dm: Outermost area of damage
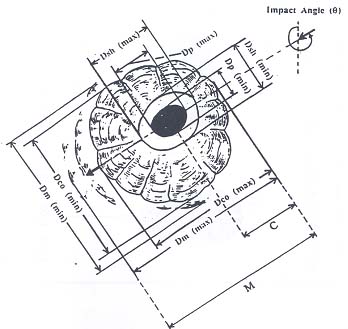
Figure 3: Impact Measurement Parameters
-V2 Wing
This image shows the position of all impact photos taken from the -V2 wing (on both front and rear side) with a low resolution camera. The "catch all" camera path is prominently visible.
+V2 Wing
This image shows the position of all impact photos take from the +V2 wing, this time only on the front side.
Total Wing
We have four sections here:- Upper and lower impacts -V2
- upper and lower impacts +V2
- -V2 lower pairs
- -V2 upper pairs
On the +V2 wing, no pairs can be observed because only the front side was photographed.
The upper and lower impacts on the -V2 wing have the following columns:
- Name: The file name of the image.
- Front X: The X position of the impact, in mm (?)
- Y: The Y position of the impact, in mm (?)
- Name: The file name of the image.
- Rear X: The X position of the impact, in mm (?)
- Y: The Y position of the impact, in mm (?)
The upper and lower impacts on the +V2 wing have the following columns:
- Picture: The file name of the image.
- X: The X position of the impact, in mm (?)
- Y: The Y position of the impact, in mm (?)
The -V2 lower and upper pairs have the following columns:
- Pair n°: The number of the pair.
- X: The X position of the impact, in mm (?)
- Y: The Y position of the impact, in mm (?)
- Xmeas: The X position of the pair in another coordinate system (?), in mm (?)
- Ymeas: The Y position of the pair in another coordinate system (?), in mm (?)
The last four items are repeated for the rear side ("cell" = "front").
Dco Flux Summary
This chart shows the relation between Flux (impacts per square meters per second) and outer shatter/spall area of an impact.
All photograph series show that the larger impacts get, the more rare they become.
Corrected Curve Only
This chart averages over the data from the previous chart.
Plots vs. Dp
In contrast to the previous charts (outer shatter/spall area), this chart shows the relation between the Flux and the central pit of an impact (in microns, not in mm as in the previous charts).
Again, it can be seen that larger impacts appear more rarely.